LSC Amazon Chargebacks: Case Study
Background
LSC Communication is a large logistics and printing provider who offers a simplified platform to print, manage, track, and ship products and goods for the publishing market. They needed a solution to resolve violation challenges from Amazon, their largest distribution carrier. The client tracked challenges through various communication channels. One method was through a shared Google Sheet. These reports were difficult to understand due to their complexity and the immense amount of data they held. As Amazon violations were received, the client would retroactively investigate why they occurred. These violations, also known as chargebacks, were penalties that would be deducted from the full amount Amazon would pay the client. We were tasked with improving the presentation of the Amazon chargebacks spreadsheets using an existing UI library we created.
The Goal
Our goal was to deliver a better design that went beyond simply delivering a nicer looking spreadsheet with a UI coating, but one that allowed the client to proactively act on violations before they occurred. Additionally, we wanted to reduce the time spent investigating issues and the number of chargebacks for each Amazon shipment.
My Role
I collaborated with my colleague Joseph, a UX designer, to lead workshops and facilitate stakeholder interviews that inform our designs. My responsibilities included collaborative user research iteration, wireframing, prototyping, usability testing, and the creation of a final high-fidelity prototype.
Project Duration
4 weeks
Design Process
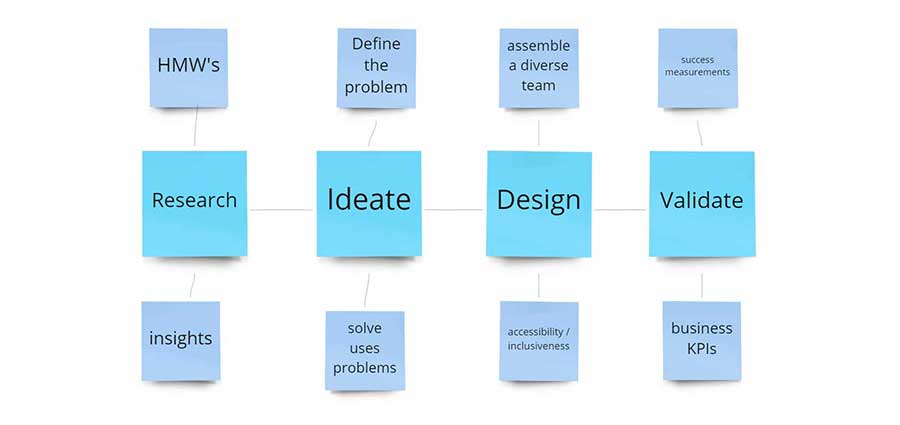
Research
In a series of discovery workshops and stakeholder interviews, we peeled back layers by asking questions to gather information and allow us to identify the client’s process, their users, how data was collected, and why. Armed with this knowledge, we then worked closely with the client to visualize potential solutions, gather input, and iterate to elaborate on ideas.
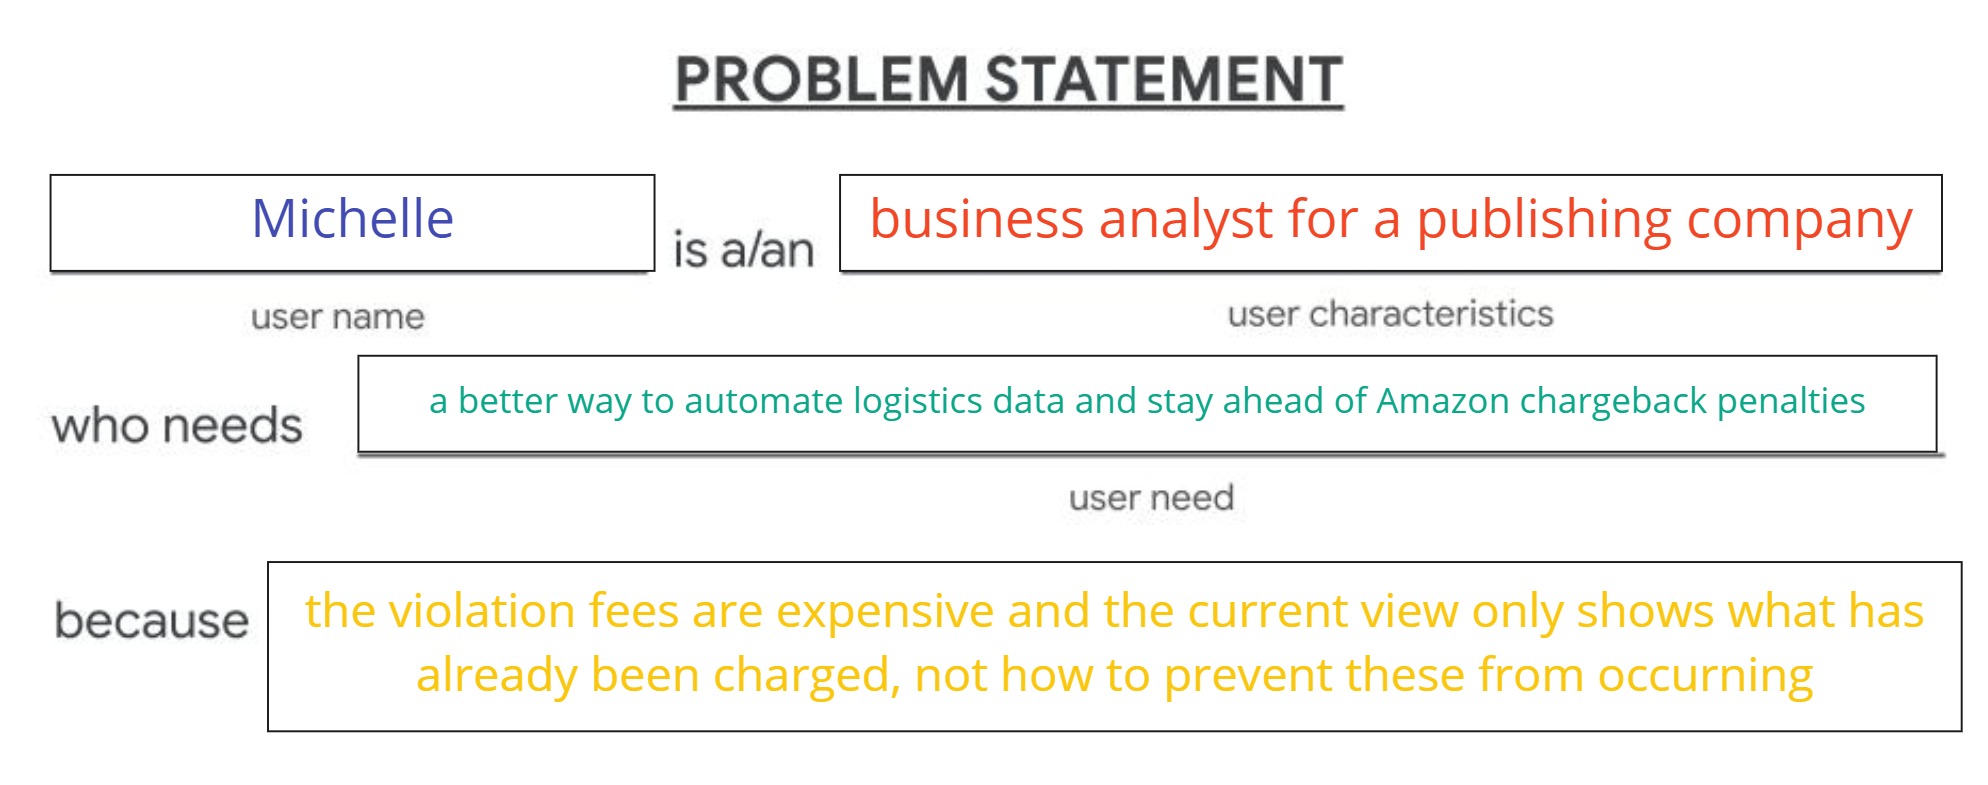
Problem Statement
LSC is a logistics and printing organization that needs to prevent revenue losses from Amazon chargeback violations due to carrier failures in their control because Amazon has strict restrictions on shipment protocol.
Pain Points
The most important pain points we uncovered were:
- Chargebacks occur automatically when there are carrier failures, like labelling issues or if shipments are incorrect or sent too late.
- Violations reports are being duplicated from the client and by their publishing customers.
- Different stakeholders receive these reports and different times and are only concerned with their own specific data.
- No integration of reports and their data
- Data is entered manually into the repots
Designs
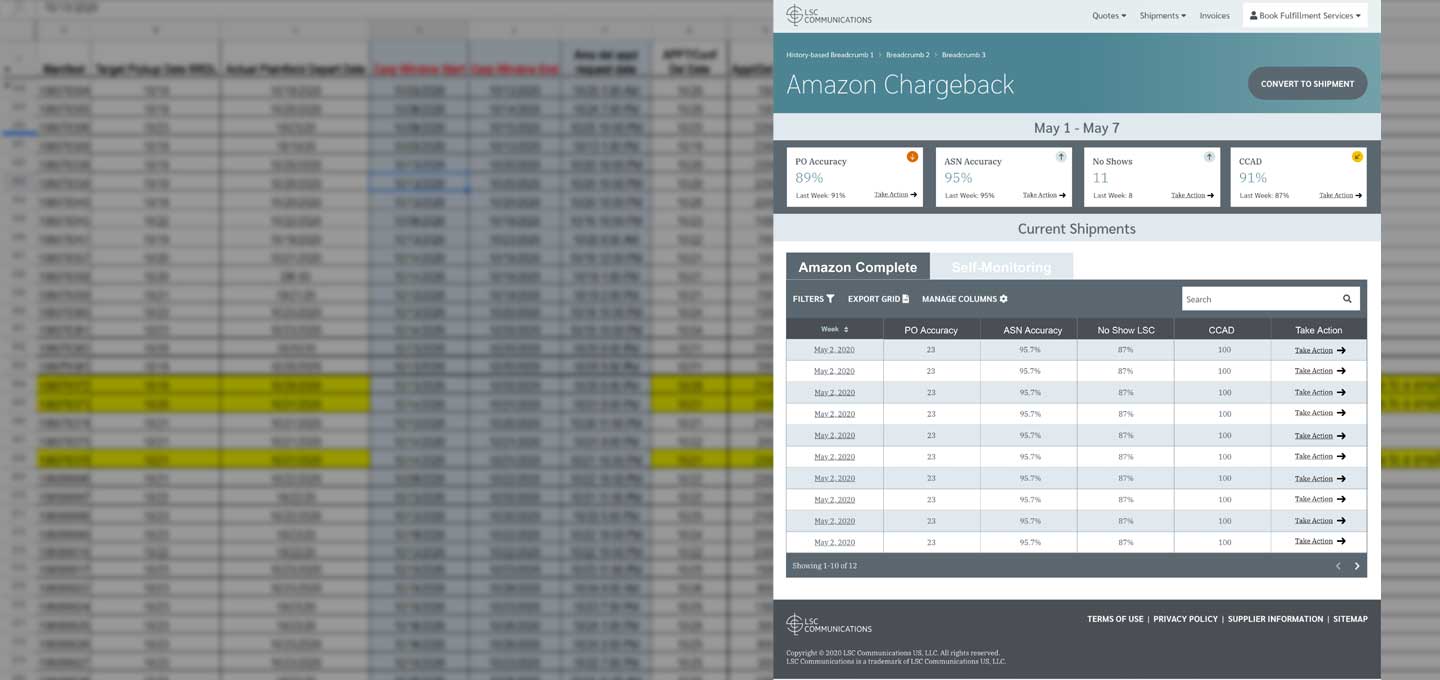
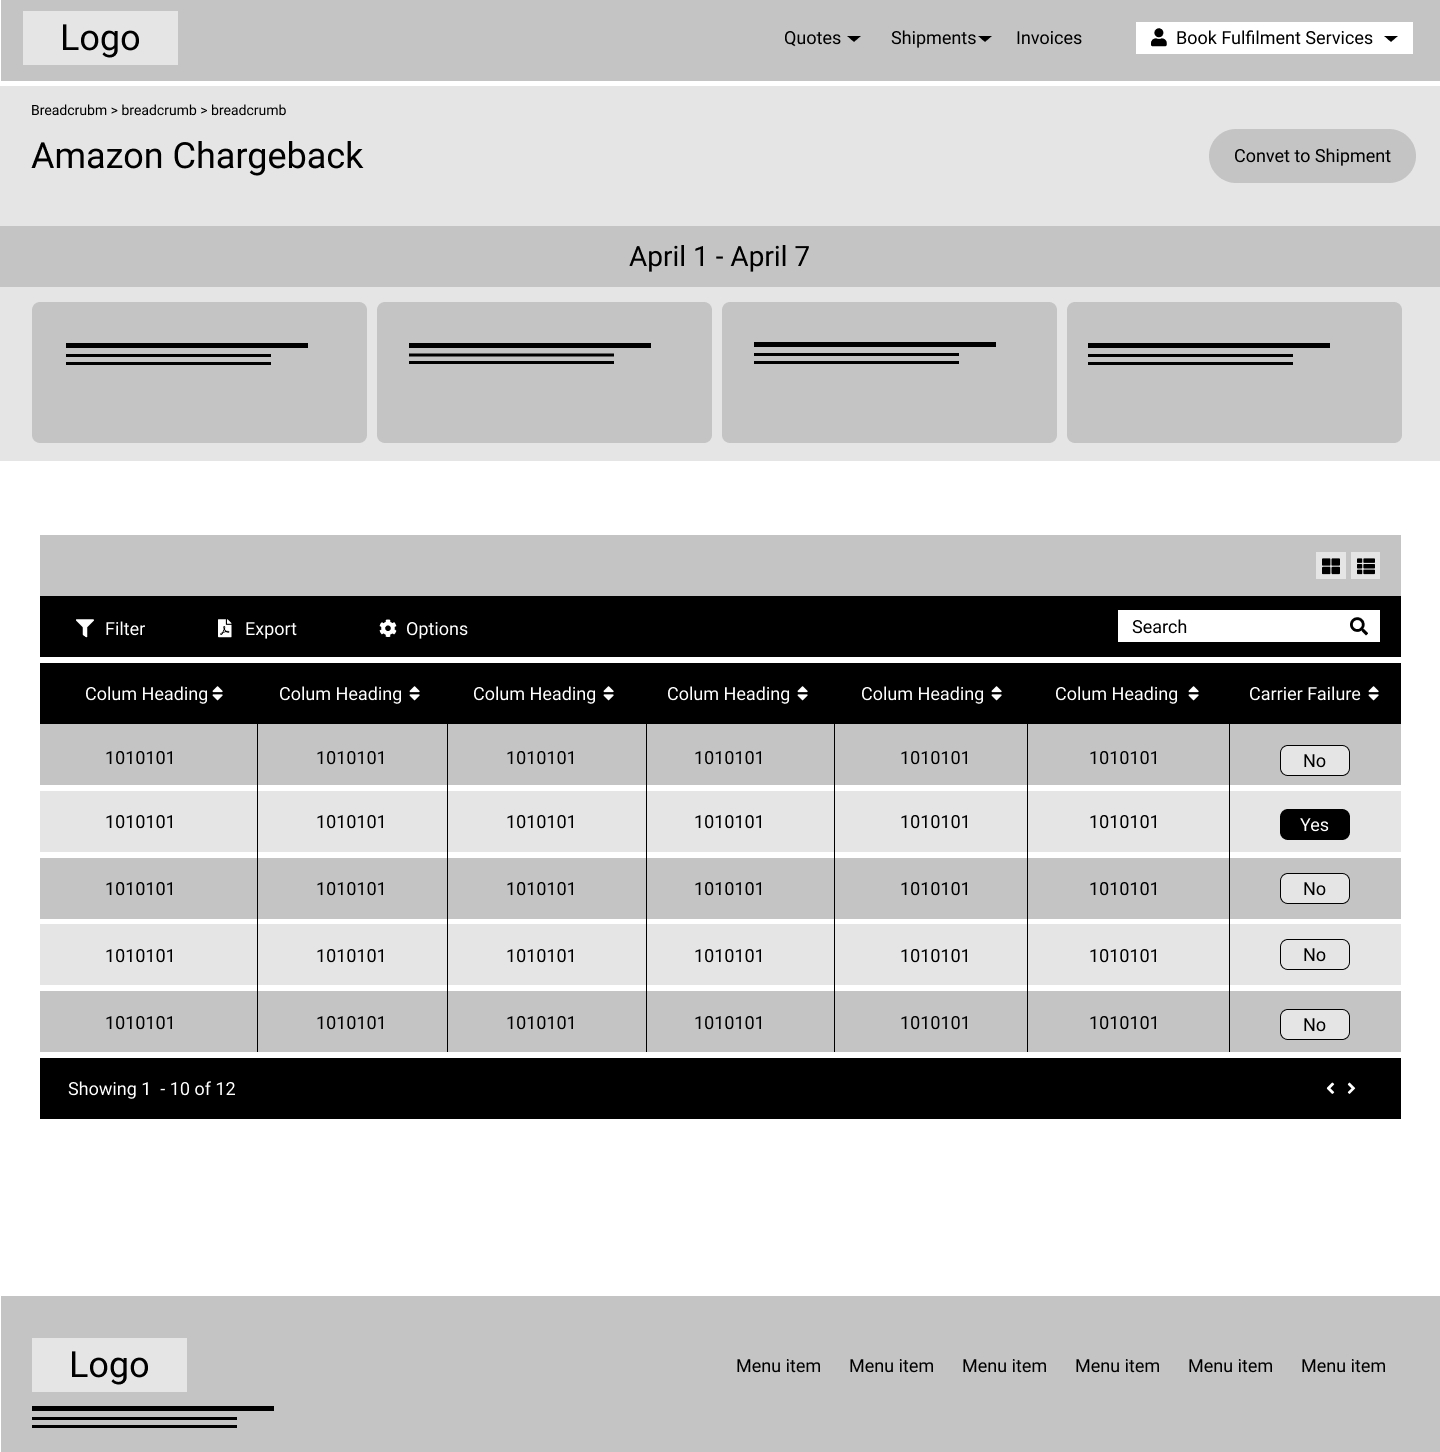
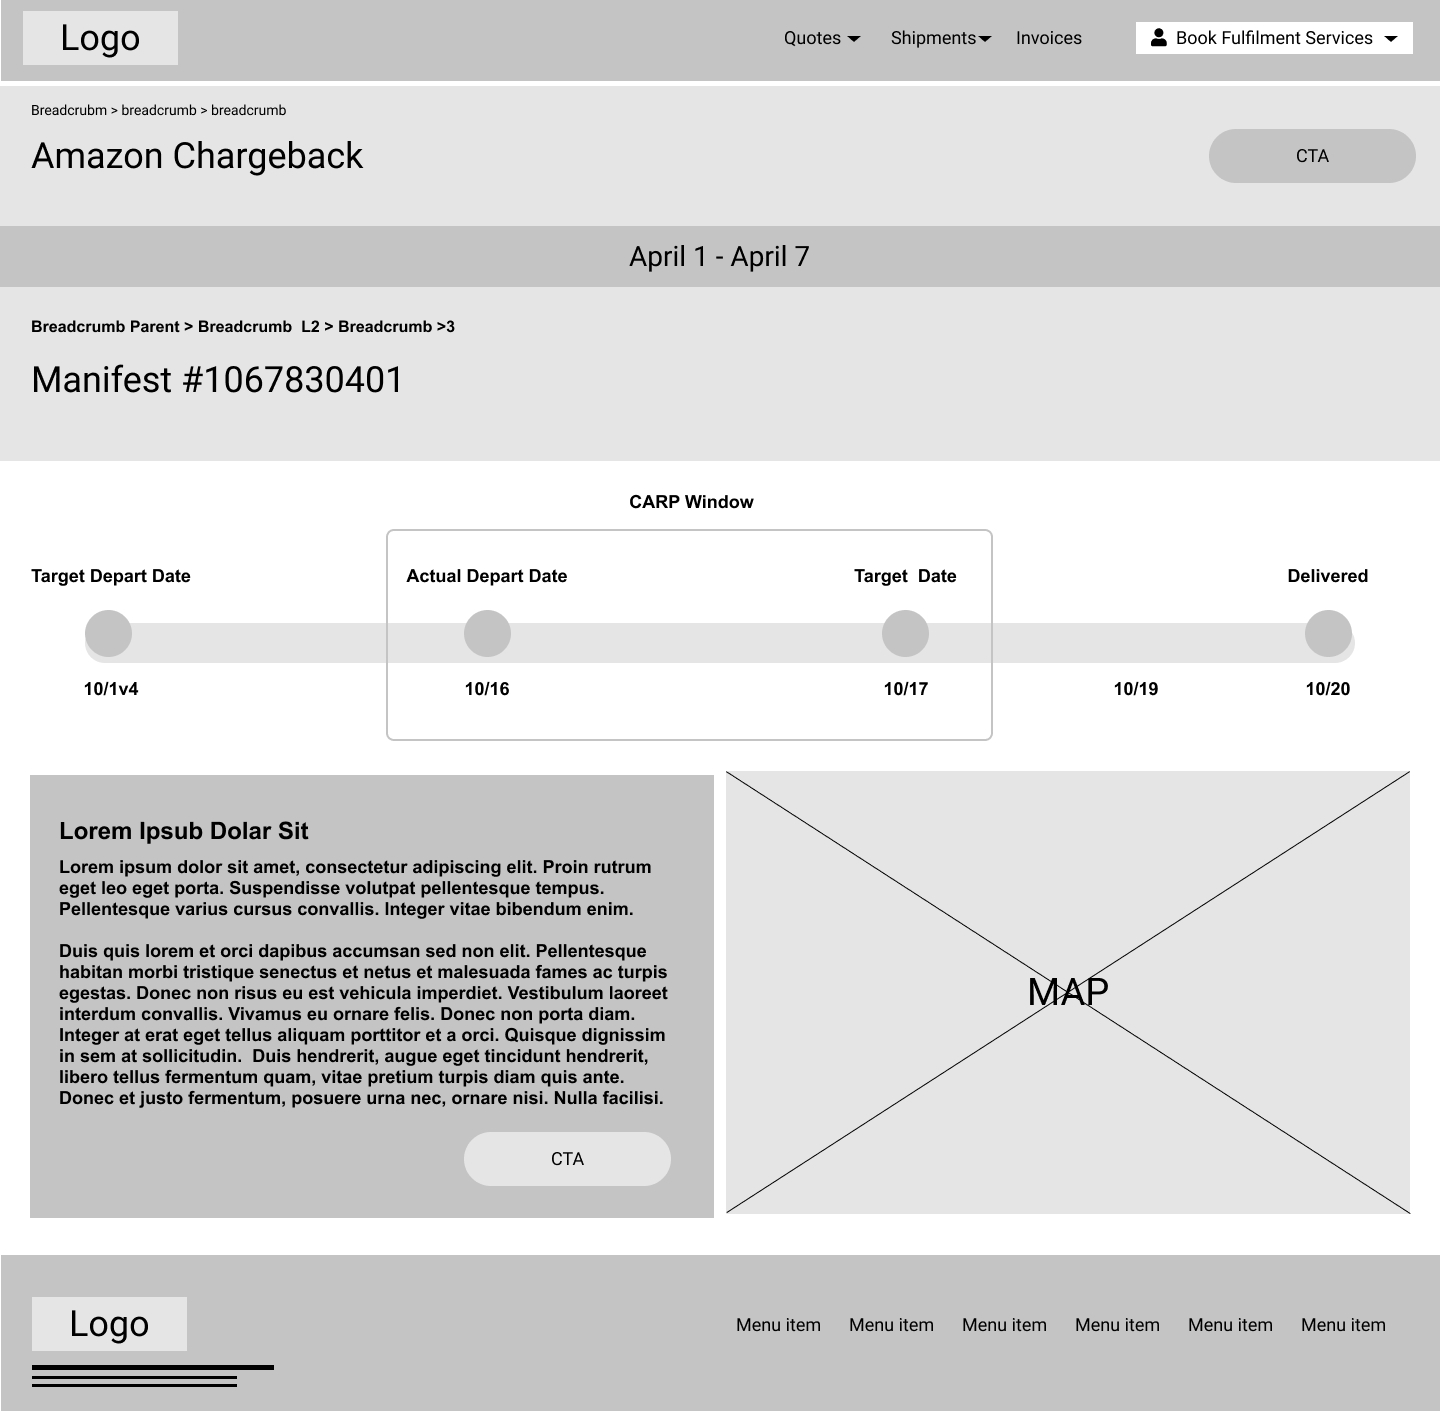
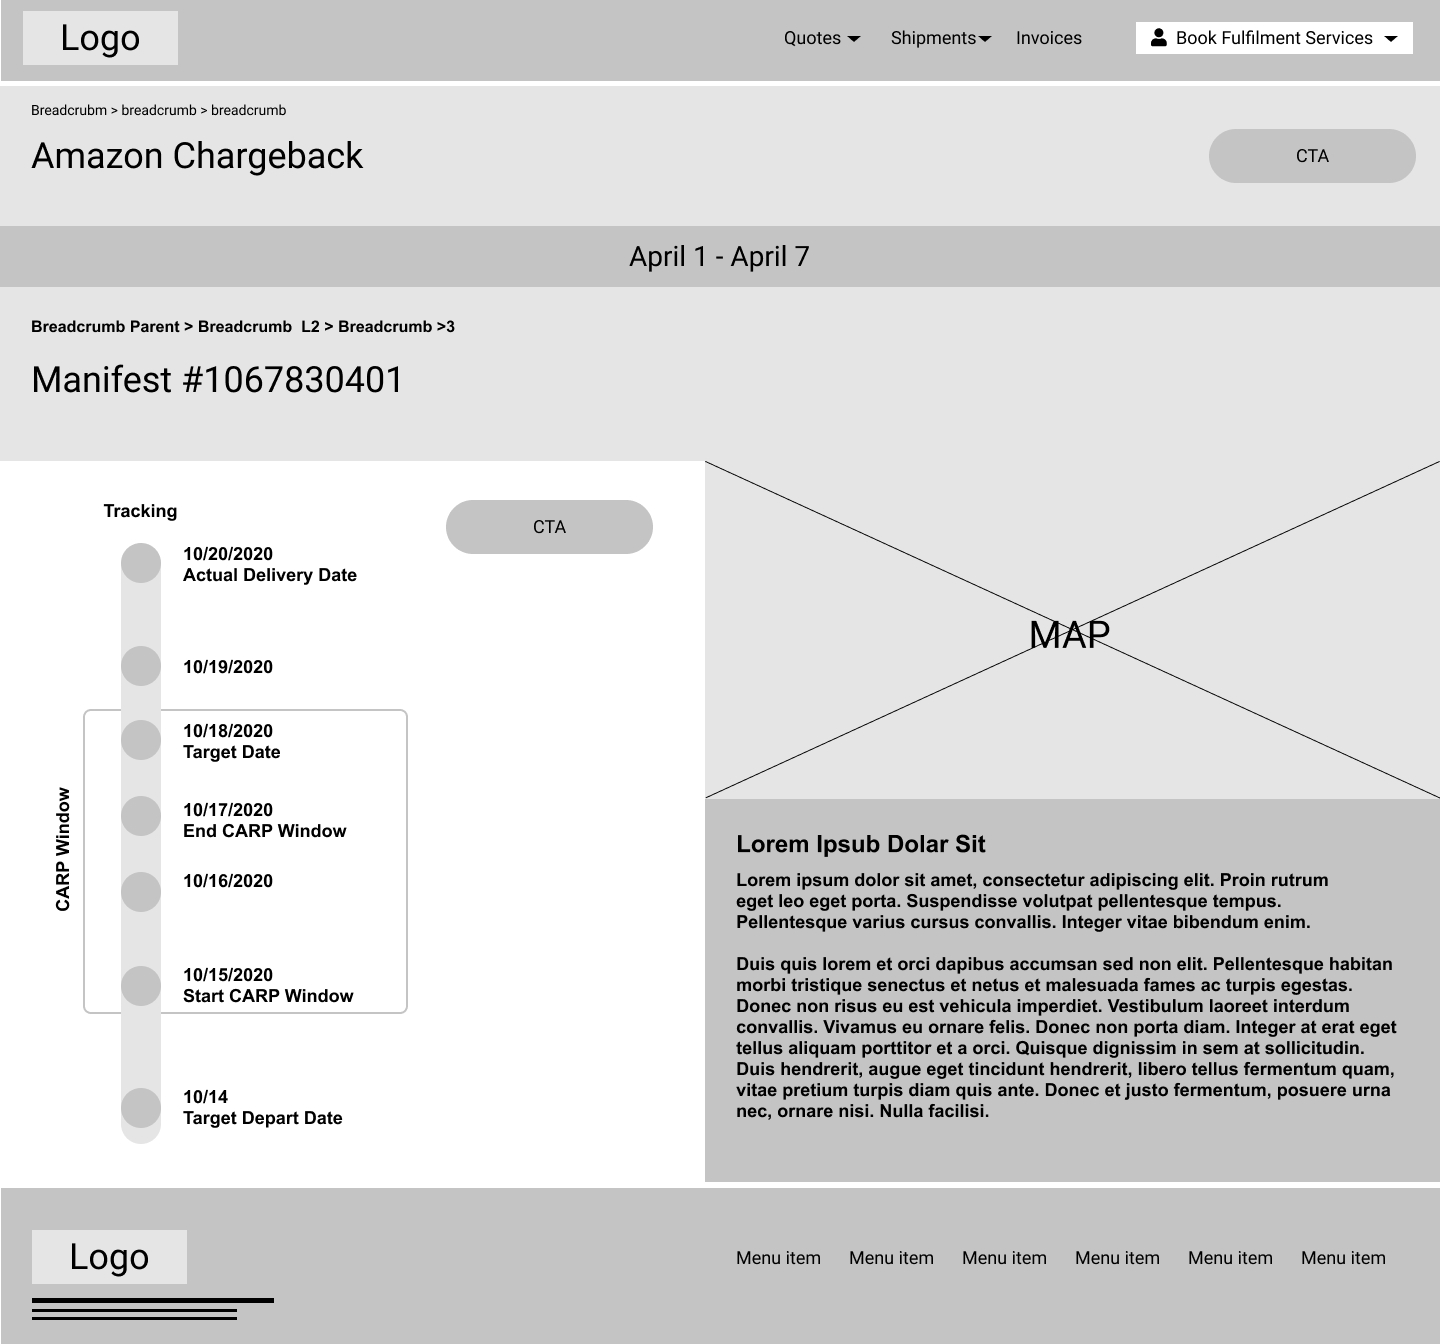
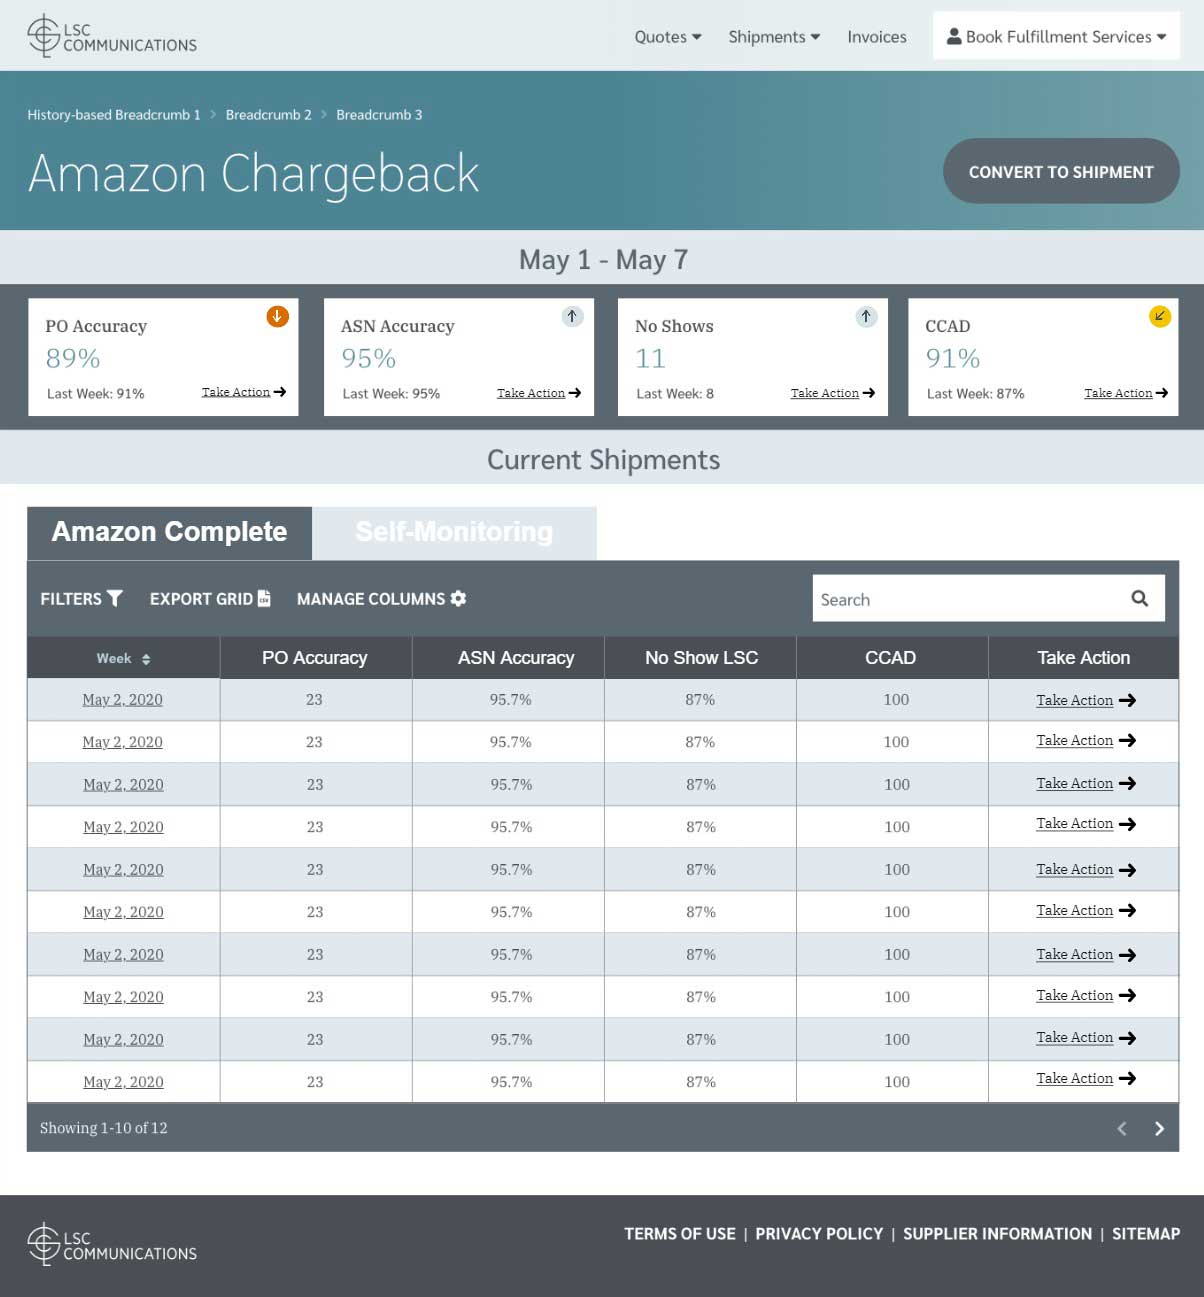
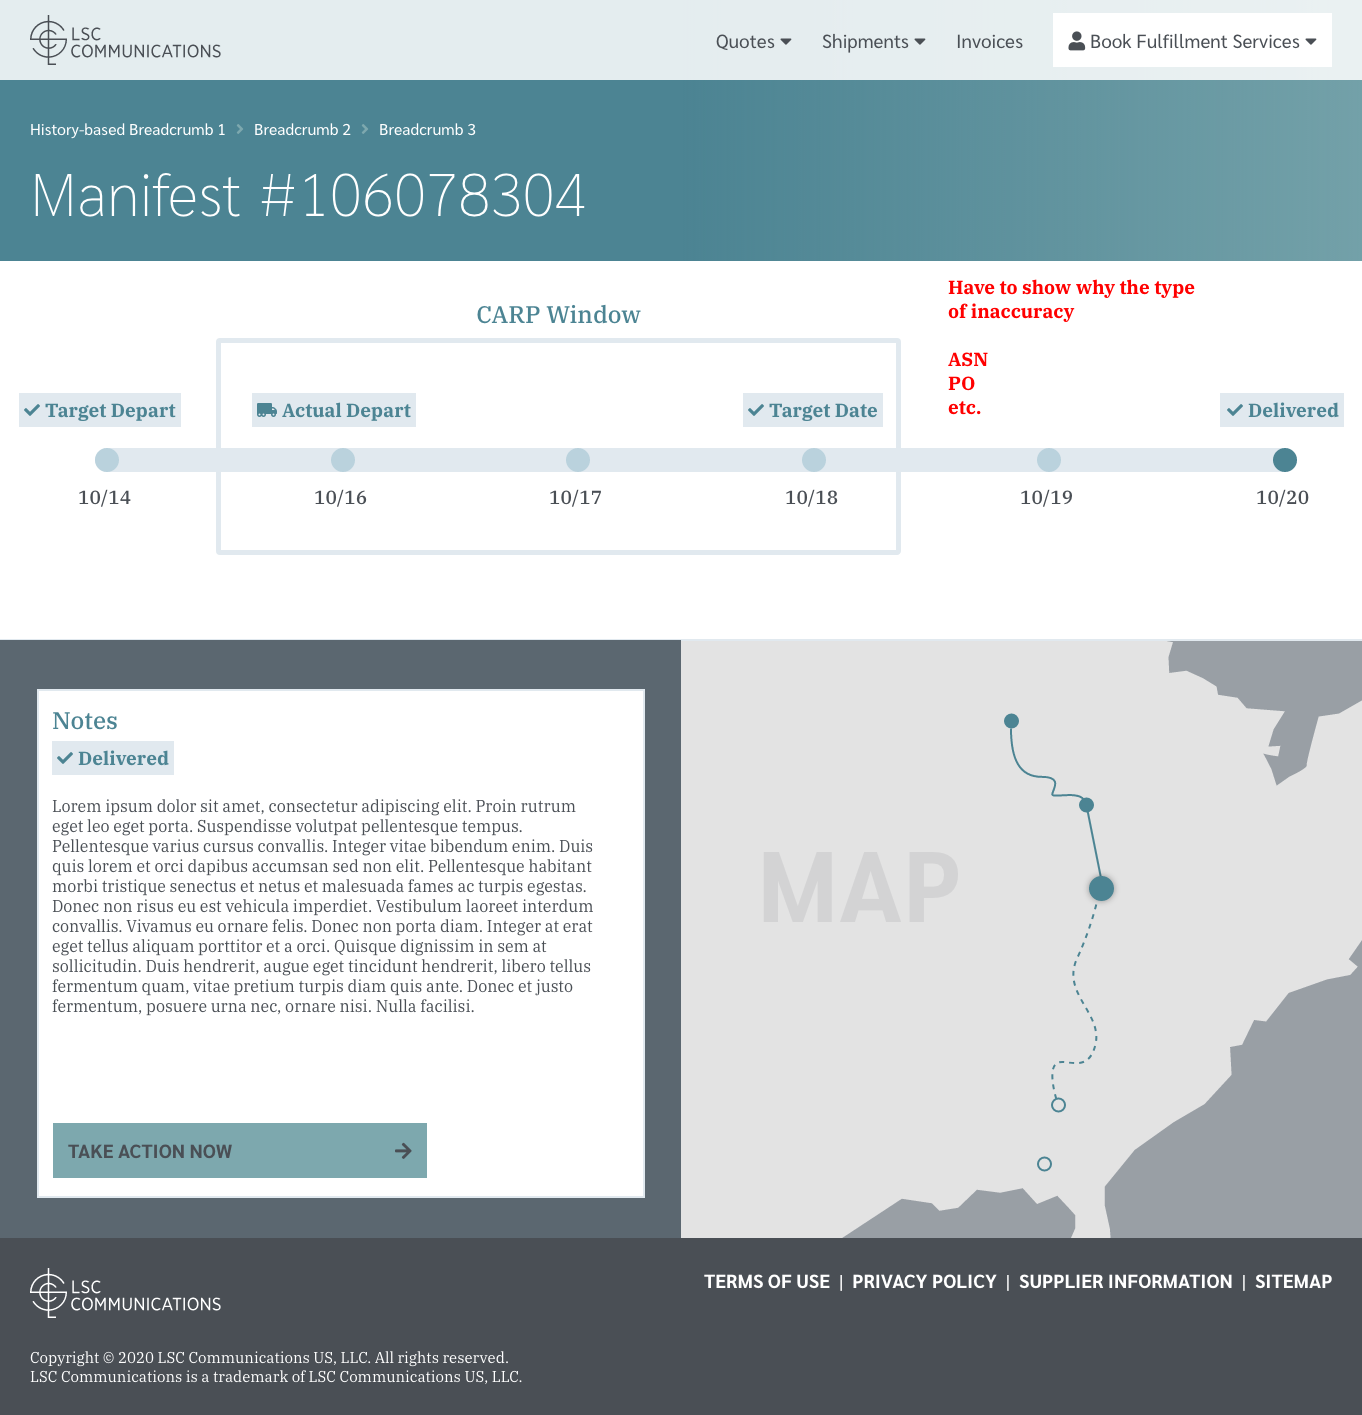
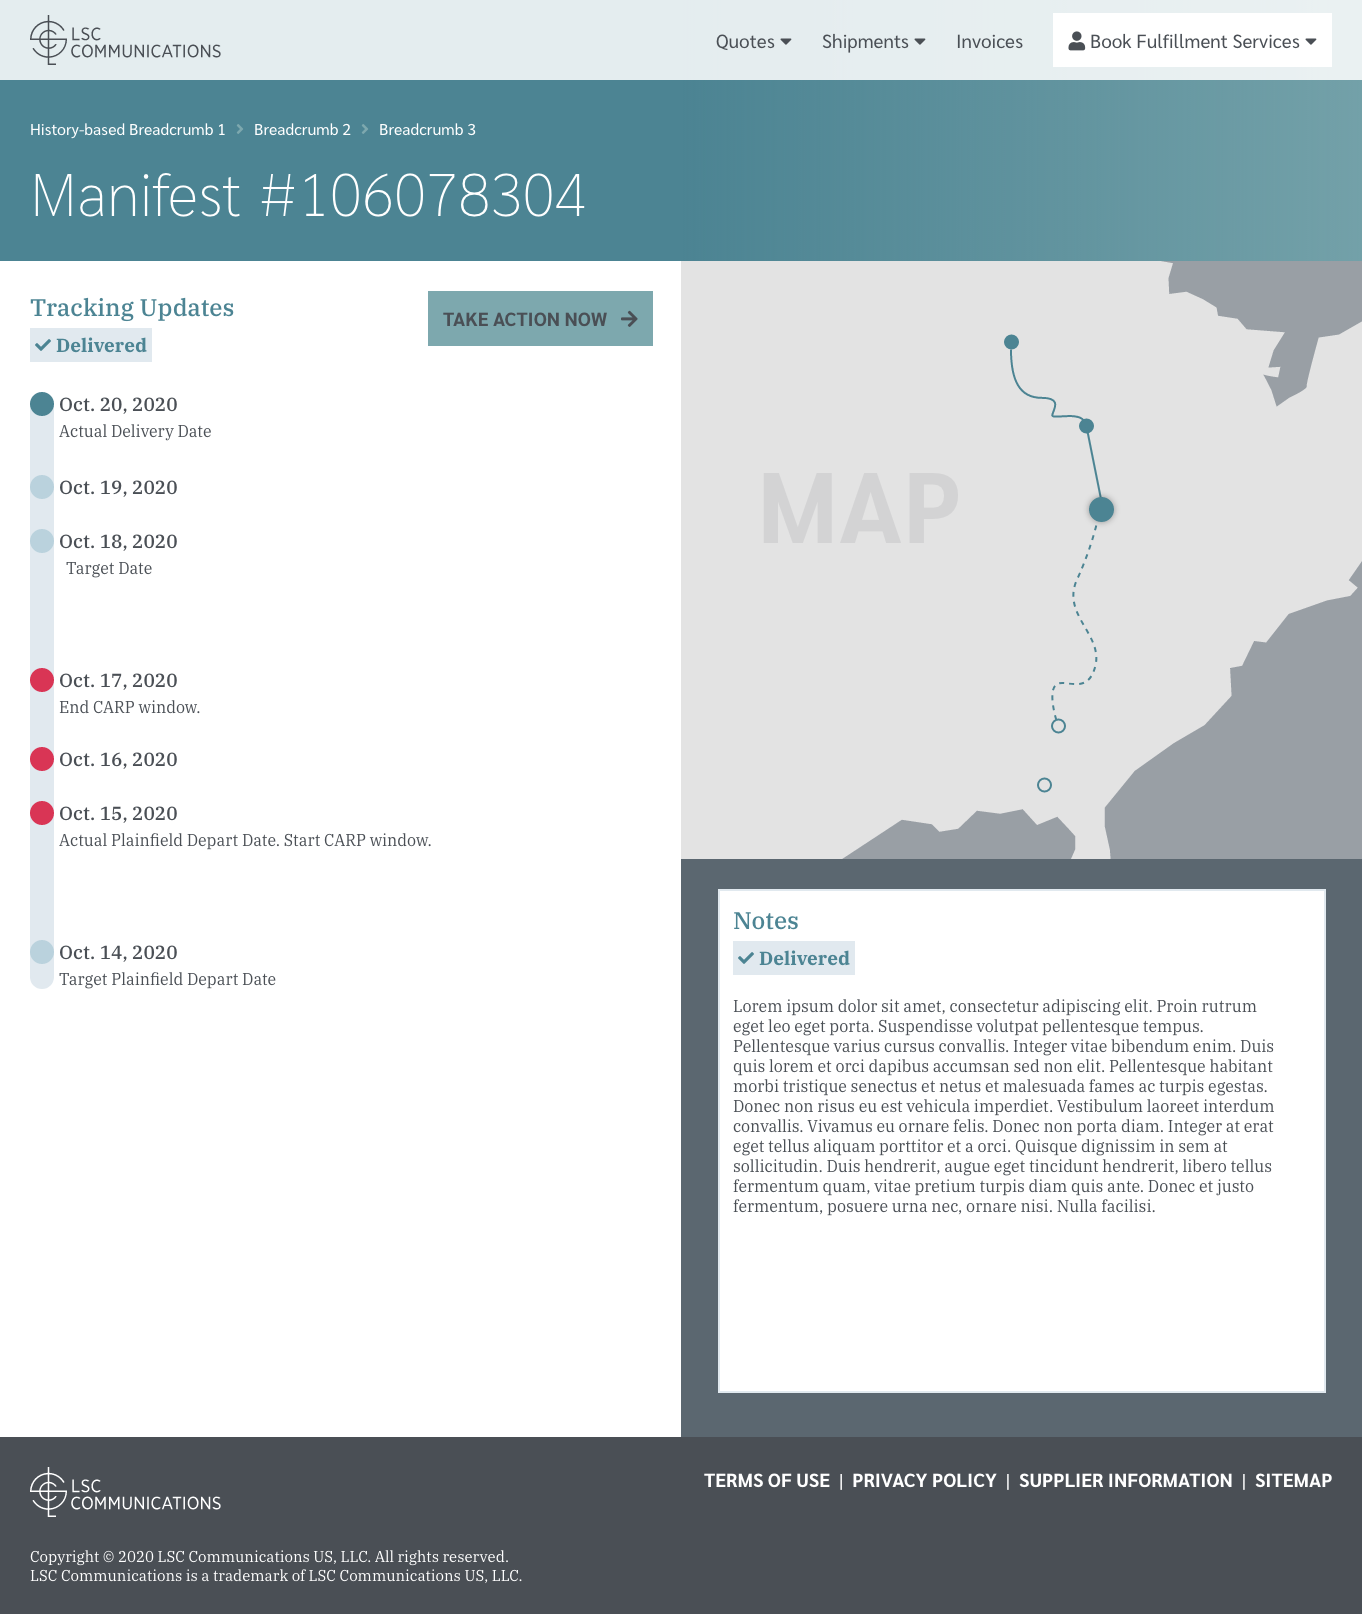
We listed to our users to address their request to view a weekly scorecard that could quickly alert them to negatively trending issues. We imagined out dashboard design delivering "at-a-glance" data across the four top categories they regularly reviewed. These containers would display current and last week’s values, as well as a trending indicator icon to quickly assess any actions being done week-over-week, and a CTA to jump in a take immediate action. Lastly, the grid below these containers displays a weekly historic view across these same four categories. From here, users can easily jump into a weekly record and view and act on the details. The next two screens demonstrate a detailed view of a single data element in a horizontal and vertical orientations. Each example demonstrates our take on displaying the actual shipment timeline in relationship to Amazon's expected window, any documentation related to the manifest, and a visual representation of the route in a map. Of course, at each step, there is a CTA for users to take immediate action, if possible.
Low-fidelity Wireframes
High-fidelity Mockups
Future Next Steps
Because of our engagement with LSS, they now have more clarity on their Amazon chargeback issues. We helped them understand how they can take a proactive approach. Instead of identifying issues after they have occurred, they now can identify pain points early on that lead to violations in the first place, and more importantly, address them.
In this context, the UI serves as a communication tool to get their team excited about the possibilities. And since we facilitated this process over a series of pseudo workshops, the LSC team has more buy-in with design thinking, as they saw firsthand how we moved from ideas to viable solutions.
Final Thoughts
In the end, we delivered more than simply a "better looking" spreadsheet. We found ways to resolve the client’s issue of proactively preventing violations and acting on these before they occurred. Through our process of UX discovery, the client could identify key areas they needed to improve upon. Namely, the potential pain points in the communication channels, how data was captured, and what data was most relevant to them. Our biggest takeaway was LSC’s appreciation of the design process that allowed them to participate in the discovery of pain points by digging-deeper and utilizing design thinking to solve problems, and not just make things look nice. In collaboration with our client, we found ways to achieve proactive approaches to preventing violations from occurring in the first place. And, yes, we also designed a polished and customized UI mockup as well.